If you start me up If you start me up I'll never stop If you start me up If you start me up I'll never stop
Ride like the wind at double speed I'll take you places that you've never, never seen If you start it up Love the day when we will never stop, never stop Never, never, never stop Tough me up Never stop, never stop
Over the last couple of years, a few academics have been making the case that land-use regulation is the cause of the housing bubble. Most of the post that follows summarizes their argument.
I think they are only partially correct. Land use regulations do restrict supply, and therefore they do impact prices. As I noted in The Great Housing Bubble:
Speculative bubbles are caused by precipitating factors.[1] Like a spark igniting a flame, a precipitating factor serves as a catalyst to begin the initial price increases that change the psychology of market participants and activates the beliefs listed above. There is usually no single factor but rather a combination of factors that stimulates prices to begin a speculative mania. The Great Housing Bubble was precipitated by innovation in structured finance and the expansion of the secondary mortgage market, the lowering of lending standards and the growth of subprime lending, and to a lesser degree the lowering of the Federal Funds Rate.
Supply shortages caused by land use regulations can cause short-term volatility in prices. The perception of a chronic real estate supply shortage in California helps sustain prices at the high levels of income debt support. The initial price rally caused by the shortage can serve as the precipitating factor causing the irrational exuberance to take over. It is the irrational exuberance and creative financing that causes the housing bubble.
So when these academics proclaim that land use regulations cause housing bubbles, they are as correct as saying matches cause forest fires. The match may start the flame, but the flame consumes the forest for a variety of other reasons not explained by the initial spark. Similarly, housing bubbles may be precipitated by a supply shortage causing a price rally, but it is the irrational exuberance of buyers thinking prices will go up forever that gives housing bubbles their strength. The full rise and fall of bubble pricing is not explained by the supply shortage alone.
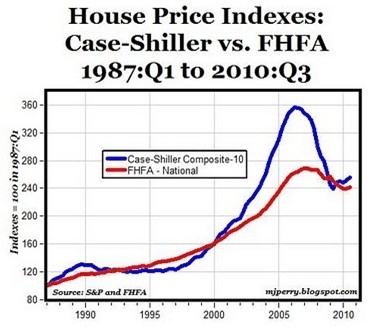
As bad as last week's housing data was, the 20 cities that comprise the Case-Shiller Composite Index are not representative of the entire United States housing market. In fact, the United States housing bubble/bust was confined to only a minority of cities. To illustrate this point, first consider the below chart (courtesy of Carpe Diem), which compares the 10-City Case-Shiller Composite Index against the FHFA House Price Index based on 50 states:
As you can see, the United States housing bubble/bust was confined, to a large extent, to the 10 cities making up the Case-Shiller 10-City Composite Index: Boston, Chicago, Denver, Las Vegas, Los Angeles, Miami, New York City, San Diego, San Francisco, and Washington, D.C.
So why was there so much variability in house price performance between United States cities, with some cities booming then busting while other cities remained relatively stable? It certainly wasn't due to liberal lending policies (easy credit), since essentially the same lending conditions were available across the United States. It wasn't because of differences in population growth, since states like Texas, which has experienced the highest population growth over the past 10 years, never had a housing bubble/bust. Rather, the differences in house price performance are accounted for by the way in which these markets regulate land use.
No. His conclusions are completely wrong. The key difference that made Texas stand out was not its less restrictive land use, it was the difference in laws pertaining to HELOCs and cash-out refinancing. Read my detailed argument here: Desire for Mortgage Equity Withdrawal Inflated the Housing Bubble.
The below table, which comes from Demographia's 6th Annual International Housing Affordability Survey, shows the extent to which the various housing markets employ restrictive land use regulations. Restrictive land use regulation, often referred to as "smart growth," "growth management," or "new urbanism," refers to policies that force people to live in higher densities while significantly restricting the expansion of suburban residential development. Measures include, but are not limited to, urban growth boundaries, areas declared off-limits to development, building moratoria, development fees and charges, and excessively large minimum lot sizes.
These academics are making themselves correct by how they define "restrictive" land use. The devil is in the details and the definitions. How should we compare the land use regulations of Texas and California? How do we determine if one place is restrictive and another permissive? How much of the data is subjective evaluations of regulatory effects subject to a wide degree of interpretation?
The data gathered by these researchers presented in different forms all boil down to the same subjective evaluations of land use regulations. If you agree with their assessment, then you will agree with their conclusions.
Cities that have adopted liberal market-based approaches ("more responsive land regulation") have experienced relatively stable housing markets, whereas those that have implemented prescriptive land use regulations have experienced volatile boom/bust cycles.
To illustrate this point, first consider the below chart, which plots the CPI-adjusted house price performance of the cities included in the 20-City Case-Shiller Composite index and deemed by Demographia as having "more prescriptive land regulations." As you can see, prices have been highly volatile, with all cities experiencing wild boom/bust conditions.
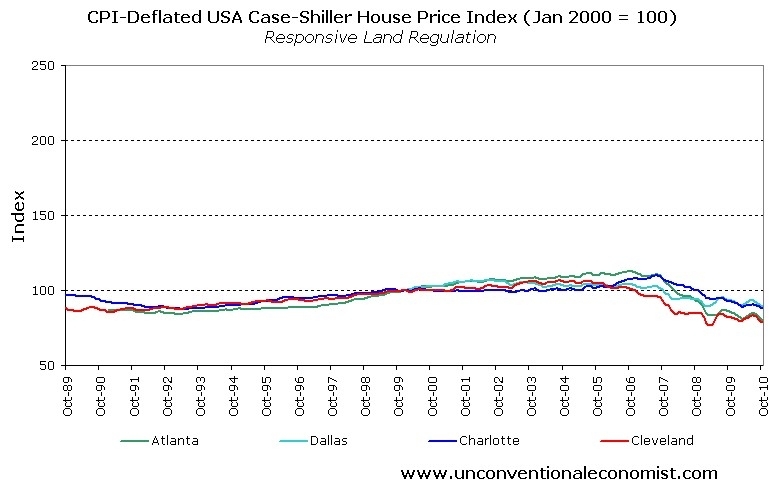
Now consider prices in the cities within the 20-City Case-Shiller Composite Index with "more responsive land regulations." As you can see, real house prices have remained relatively stable in the supply-responsive cities.
The situation is similar at the state level using FHFA housing data. First, consider the states with "more prescriptive land regulations": Now consider states with "more responsive land regulations": Again, it's the same story, with the highly regulated states experiencing wild boom/bust cycles whilst prices in the market-oriented states remained relatively stable.
If you accept their methods of classifying land use regulations, then you will agree with their findings. If not, you won't. Garbage in, garbage out.
Economics 101
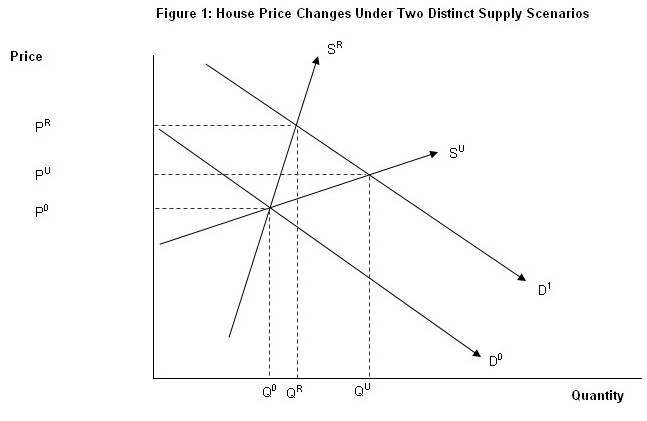
The economic forces underpinning the above findings are perhaps best explained through basic supply and demand analysis. Consider the below chart taken from an earlier article on this issue. Q0 and P0 represent the initial equilibrium situation in the housing market. Initial demand is provided by D0, whereas supply is shown as either SR (restricted) or SU (unrestricted), depending on whether land supply constraints exist.
Following an increase in demand, such as that brought about by a significant relaxation of lending standards, the demand curve shifts outwards from D0 to D1. When land supply is restricted, house prices rise sharply from P0 to PR. By contrast, when supply is unrestricted, prices rise more gradually from P0 to PU.
The situation works the same way in reverse. For example, if there was a sharp fall in demand following a contraction in credit availability or a sharp rise in unemployment, causing demand to fall from D1 to D0, then prices fall much further when land supply is constrained.
The key point is that increases (declines) in demand can bring sharply rising (falling) house prices when supply is constrained. However, when land supply is not regulated, it adjusts to demand and house price volatility is reduced.
The effect on markets in the short term is how they describe above. However, that only explains the first stages of a market rally. Once prices are high, and they have been rising long enough for people to take interest, the market needs help in order to keep going higher. It is financial innovation folly that must take over to build a significant real estate bubble.
These observations are consistent with those of Glaeser and Gyourko, who summarised the findings of a number of studies in this area:
Recent research also indicates that house prices are more volatile, not just higher, in tightly regulated markets .... price bubbles are more likely to form in tightly regulated places, because the inelastic supply conditions that are created in part from strict local land-use regulation are an important factor in supporting ever larger price increases whenever demand is increasing.
.... It is more difficult for house prices to become too disconnected from their fundamental production costs in lightly regulated markets because significant new supply quickly dampens prices, thereby busting any illusions market participants might have about the potential for ever larger price increases.
Learning history's lessons
As long as commentators focus primarily on the demand side of the housing market, whilst ignoring supply-side constraints, they will never fully understand the drivers of housing bubbles and busts. The resulting incorrect diagnosis will inevitably lead to poor policy prescriptions and outcomes.
By all means, let's crack down on the destructive speculation, predatory financing and financial alchemy that have fuelled the world's housing bubbles. At the same time, let's not ignore the supply-side barriers that have enabled the credit-fuelled demand to feed into skyrocketing house prices which, in the case of the United States, later collapsed once the artificial demand evaporated.
Readers seeking detailed information on issues pertaining to the supply-side of the housing market are encouraged to visit the Demographia and Performance Urban Planning websites. Also, please be advised that the 7th Annual Demograhia International Housing Affordability Survey will be released on 24 January 2011. It's sure to be another great read.
Having worked most of my career in the land development industry, I understand the desire to reduce land use regulations which hinder our ability to deliver housing. When we can't deliver housing, there are shortages and short-term price rallies. However, much of our land use regulation is good and should not be abandoned, and the likelihood of the regulations rolling back to some more permissive era is slim to none.
How to ruin a good cashflow investment with excessive borrowing
There was a time when banks were smarter about loaning money on cashflow properties. Besides an appraisal showing comparable sales, a process prone to bouts of irrational exuberance, lenders on rental properties also look at stabilized cashflow to determine if the cashflow from the property can cover the loan payments in the event of foreclosure.
During the Great Housing Bubble, lenders did not bother to check actual cashflow. During the savings and loan disaster, developers had to make up rosy financial projections to demonstrate income in order to get lenders to approve the loan. During the bubble, since lenders thought they were passing the risk on to others in mortgage-backed securities, lenders did not care about whether or not the cashflow covered the income.
At some point after this property was purchased and before the owner went Ponzi, rents rose enough to make this property cashflow positive. By 2002, this was finally a profitable rental. At least until the owner started his borrowing spree which culminated in a $450,000 ARM.
The owner quit paying the ARM in mid 2008, and he is probably still skimming rent from whoever lives there.
Foreclosure Record Recording Date: 01/05/2010 Document Type: Notice of Sale
Foreclosure Record Recording Date: 12/15/2008 Document Type: Notice of Sale
Foreclosure Record Recording Date: 09/05/2008 Document Type: Notice of Default
Home Purchase Price … $275,500 Home Purchase Date .... 11/3/1992
Net Gain (Loss) .......... $158,780 Percent Change .......... 57.6% Annual Appreciation … 2.8% Cost of Ownership ------------------------------------------------- $462,000 .......... Asking Price $16,170 .......... 3.5% Down FHA Financing 4.86% ............... Mortgage Interest Rate $445,830 .......... 30-Year Mortgage $94,143 .......... Income Requirement
$2,355 .......... Monthly Mortgage Payment
$400 .......... Property Tax $0 .......... Special Taxes and Levies (Mello Roos) $77 .......... Homeowners Insurance $300 .......... Homeowners Association Fees ============================================ $3,133 .......... Monthly Cash Outlays
-$386 .......... Tax Savings (% of Interest and Property Tax) -$550 .......... Equity Hidden in Payment $30 .......... Lost Income to Down Payment (net of taxes) $58 .......... Maintenance and Replacement Reserves ============================================ $2,285 .......... Monthly Cost of Ownership
Cash Acquisition Demands ------------------------------------------------------------------------------ $4,620 .......... Furnishing and Move In @1% $4,620 .......... Closing Costs @1% $4,458 ............ Interest Points @1% of Loan $16,170 .......... Down Payment ============================================ $29,868 .......... Total Cash Costs $35,000 ............ Emergency Cash Reserves ============================================ $64,868 .......... Total Savings Needed
Property Details for 139 STANFORD Ct 38 Irvine, CA 92612 ------------------------------------------------------------------------------ Beds: 3 Baths: 3 baths Home size: 1,354 sq ft ($341 / sq ft) Lot Size: n/a Year Built: 1985 Days on Market: 4 Listing Updated: 40547 MLS Number: 11498103 Property Type: Townhouse, Residential Community: West Irvine Tract: Ws1 ------------------------------------------------------------------------------ According to the listing agent, this listing may be a pre-foreclosure or short sale.
This is an Approved Shortsale at $462,000 (was appraised at this price 2 weeks ago)we have until the 20th of January to close we wont accept anything less then $462,000, This is a Beautiful 3+3 Townhome, w one car garage and one covered carport.Last time we had 4 offers in 2 days, Previous Buyer paid for inspection an appraisel last minute decided to stay over sea's and not move to the U.SWe might need to use their lender since they have all paperwork and can close in 12 days approx. to make an offer or any questions please look at privete remarks.
we wont accept anything less then $462,000? Don't hold your breath waiting for my offer of $461,500.
Last time we had 4 offers in 2 days. Wow! What a great realtor....


0 comments:
Post a Comment
Note: Only a member of this blog may post a comment.